Cell Detection
Create cell objects using QuPath’s built in detection algorithm.
The following video details the use of QuPath’s built-in cell detection. Make sure to use full resolution (HD) to see all text!
Cell Detection (QuPath built in)
QuPath's built-in cell detection offers a fast and efficient first step in cell analysis within digital pathology images. Its default settings typically perform well on brightfield images, provided the image metadata, which includes pixel size, is accurate. Cell detection algorithms use size limits based on square microns; use manual annotations to validate pixel metadata if you are unsure. For example, if you use the brush tool to annotate a cell and the area is in hundreds of thousands or tenths of square microns, something is clearly wrong! If pixel size metadata is absent, consulting with microscopy professionals is essential, performing pixel based cell detection can be very challenging as there is no standard number of pixels that define an average cell size - pixel sizes depend entirely on the microscope and optics.
The cell detection interface is accessible via the 'Analyze > Cell Detection' menu. For successful detection, you'll need:
An area annotation on the image, as cell detection won't run on an image without annotations - or on existing detection objects.
A clear nuclear signal, as cell detection is primarily nuclear detection followed by a cytoplasmic expansion that is independent of surrounding pixel values. Consider using CellPose instead if you have time, computing resources, and a strong signal that defines the border of your cells.
In scripts, annotations must be actively selected before running cell detection. Running cell detection through the GUI will prompt for annotation selection if none are selected, while scripts may fail silently if this step is omitted.
QuPath's cell detection algorithm searches for intensity peaks to identify nuclei and then delineates cell borders through expansion, adjusting for nearby cells using a watershed separation technique. Cytoplasmic stains do not influence cell size or shape, and there's no current feature to include other channel information in the expansion process.
Running cell detection overwrites any existing lower-level objects within the annotation hierarchy, which is ideal for iterative testing but can result in loss of previously detected cells or annotations. Therefore, it is recommended to perform cell detection before creating detailed sub-annotations (tumor vs stroma, for example) with tools like pixel classifiers.
The resulting objects from cell detection are classified as either CellObjects if the cell expansion value is greater than 0, or Detections if it there is no cytoplasm. This distinction is crucial for subsequent analysis, such as subcellular detection, which operates exclusively on CellObjects.
Lastly, it's important to be aware of how cytoplasmic expansion is constrained by the annotation's bounding box, not the annotation border itself. The nuclei, however, will always be constrained to the annotation border. This can affect the final cell shapes, especially in non-rectangular annotations, and is particularly relevant when cells are near the annotation edges - see the video at 3 minutes. Perhaps the most important result of this is that if cell detection is run AFTER creating tumor/stroma annotations, the cells along the border will have cytoplasmic expansions that overlap with one another, and nuclei may be split in two. This is another reason to run cell detection on the whole tissue first, before creating subdivisions.
For additional discussion, see Clipping cells to ROIs on the Image.sc forum, which includes a script to crop cells that expand over annotation boundaries (though this does not update the measurements, it is purely visual), and mention that StarDist can stop cell expansion at ROI boundaries.
In summary, careful attention to the selection and settings when using QuPath's cell detection can greatly impact the quality and utility of the resulting data for further analysis.
Interface
See the brightfield section on cell detection for more complete details
Channel - The channel for nuclear detection. If there is a channel called DAPI it will default to that, or the first channel in the list of channels.
Requested Pixel Size - This determines the downsample at which the algorithm "looks" at the image. Regardless of what you enter, the QuPath will always "snap to" a factor of two from the base pixel size when the function is run. The two most common uses will be the default pixel size, or 2x the pixel size for some downsampling for very high resolution data.
Background radius - Associated with the Max background intensity in brightfield images for cell removal in tissue folder, in fluorescence images this value simply acts as an attempted detection of background levels for making the nuclei easier for the algorithm to detect. I often set this to 0 for IF so that I can estimate the Threshold value based on the intensity of the pixels in the image. If you keep a background radius, you will need to experiment more with a good Threshold setting, but the results may be better if you do have a high background.
Use opening by reconstruction - uncheck this is you are having issues with certain cell detection tiles having no cells when it looks like they should. https://github.com/qupath/qupath/issues/80#issuecomment-305385370
Median filter radius - Median filter blurring
Sigma - Gaussian filter blurring, increase to increase the average size of detected nuclei.
 Note
Note
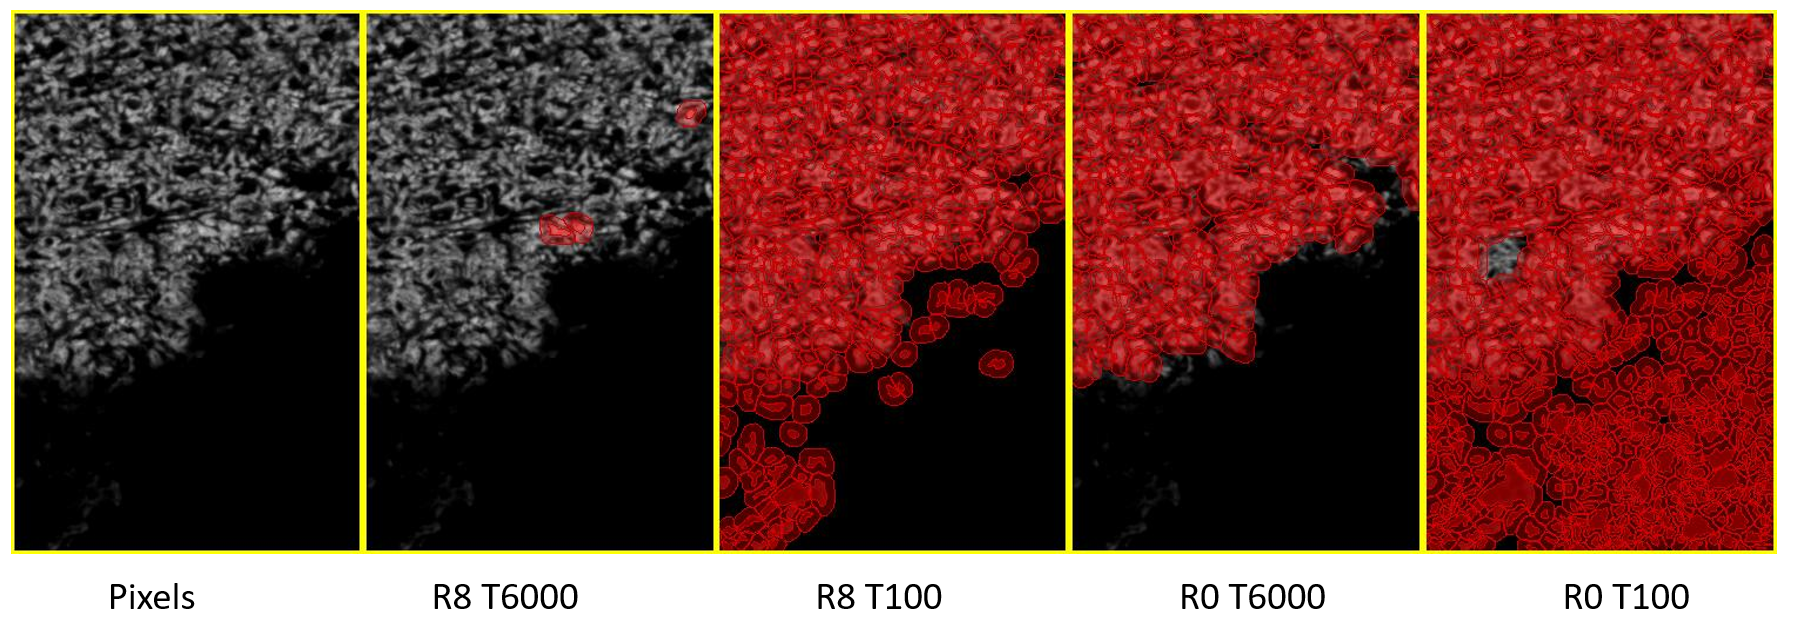
The sequence of images above illustrates how the interaction between the Threshold and Background Radius settings can influence cell detection in the Orion 6 demo image. The first image displays the original pixels of the nuclear channel.
In the second image, the Background Radius is set to its default value of 8, and the Threshold is at 6000. At these settings, the detection of cells is minimal. In the third image, while maintaining the Background Radius at 8, the Threshold is lowered to 100, which is slightly above the difference between the detections and the estimated background level. This adjustment results in the detection of a few additional cells without a significant increase in noise.
The fourth and fifth images show the results with the Background Radius disabled (set to 0), applying the Threshold directly to the pixel values. Here, a Threshold of 6000 appears to isolate cells accurately, whereas a Threshold of 100 leads to the detection of background noise.
The takeaway is that with a Background Radius of 0, the Threshold operates on actual pixel values, which can be more straightforward to estimate based on reading the pixel values in the image. However, when the Background Radius is greater than 0, one must consider the noise tolerance and background intensities, as the optimal threshold value could be substantially lower, varying with the specifics of the imaging system and the sample's inherent background.
Minimum and maximum area - These are specific to the nucleus. If there are small nuclei not being detected, reduce the Minimum area, or increase the Maximum area if you have particularly large nuclei. Use annotations to validate the sizes you choose, since you can control the annotation size and look at its area. The wand tool can be particularly nice for this, clicking on a nucleus.
Threshold - The minimum value for the entire nuclear area AFTER smoothing is applied. The more smoothing you apply, generally the lower this value will need to be, and the larger your cell nuclei will end up. This can be an important factor to keep in mind if nuclear size is a significant measurement. As a side note, the nuclear area itself is always a suspect measurement, as it is highly dependent on the angle and placement of the tissue slice through the nucleus.
Checkboxes - I strongly recommend leaving most of the checkboxes checked unless you have some particular need to uncheck them. The only one that might be of some interest is unchecking the Smooth boundaries in order to get pixel perfect edge outlines, and not include partial pixels. This may help when generating masks, though I have not tested it extensively.
Cell expansion - use the slider to determine how large you want the cytoplasmic expansion to be. Cells will always be constrained by other cells (other nuclei), and increasing the expansion too much can have very odd effects on tissue borders where the cells would include odd amounts of empty space, or image borders where the expansion will be halted making the whole cell smaller than expected.
Object visualization
The interface offers a variety of visualization settings for objects within the software. Users can manage the visibility of object categories such as Annotations, Detections, and Tissue MicroArrays (TMAs), as well as activate or deactivate the pixel classifier overlay and object names. A transparency slider is also available, allowing adjustment of the visibility for most objects and overlays presented on the screen, except for the object that is currently selected.
Measurement Maps
For a visual demonstration, please refer to the tutorial video at the timestamp of 6 minutes and 52 seconds
The GUI command can be found at Measure -> Show measurement maps.
Cell detections come with a suite of measurements that can be graphically represented through measurement maps. These maps offer a dynamic method to display various measurements, which becomes increasingly useful as users familiarize themselves with the software and begin to script their own commands. This feature facilitates the visualization of complex data, such as the interplay or correlation among different channels, which could be challenging to interpret using just the channel viewer on the full sample.
Cell visualization options
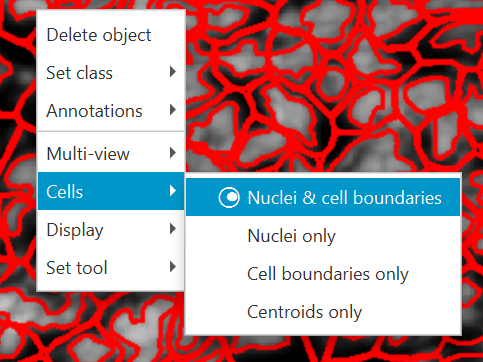
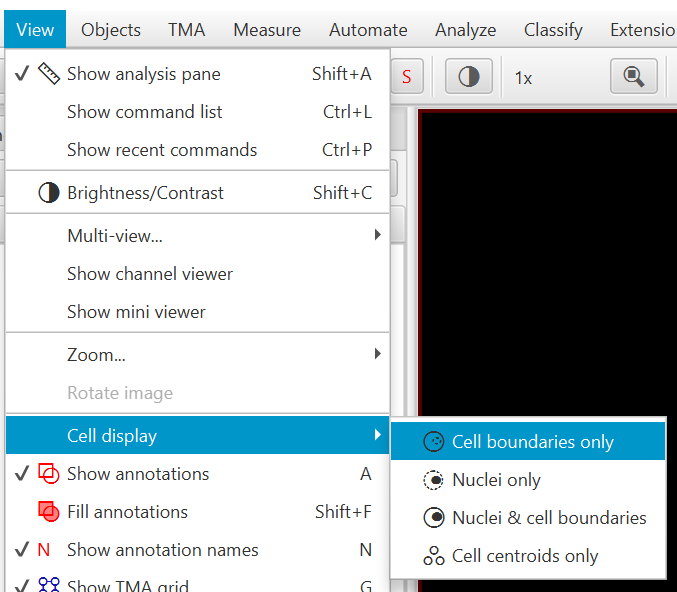
Cell objects have four different potential representations, as shown to the right, which can be accessed either through the context menu in the Viewer, or through the View menu.
Nuclei & cell boundaries (B1 and C1, right) shows the most spatial information, with both the nuclear border and the cytoplasmic border being visible at the same time. This display mode is nice for when you need to see both borders, but otherwise has the significant drawback that it is always semi-transparent, making it harder to visualize measurement maps, and the sheer amount of squiggles over the image data can make it hard to interpret the image behind the overlay.
At the other end of the spectrum is the Centroids only (A3 and B3, right) mode, which shows spots that are shape coded based on the number of sub or derived classes present within that object.
Circle = no class
Square = 1 class
Triangle = 2 classes
Plus = 3 classes
X = 4 classes
Both Nuclei only (B2) and Cell boundaries only (A2) have the advantage that, when filled in, provide a completely opaque object, perfect for combining with Measurement Maps. Measurement Maps can work with all display options for detections and cells, but these two are by far the most visually striking (C2,3).
All measurement types can have “fill” turned on or off, as shown in (B1 vs C1), and (A3 vs B3).
Accessing the cell visualization options, through right clicking within the viewer (left) and the View menu (right).


